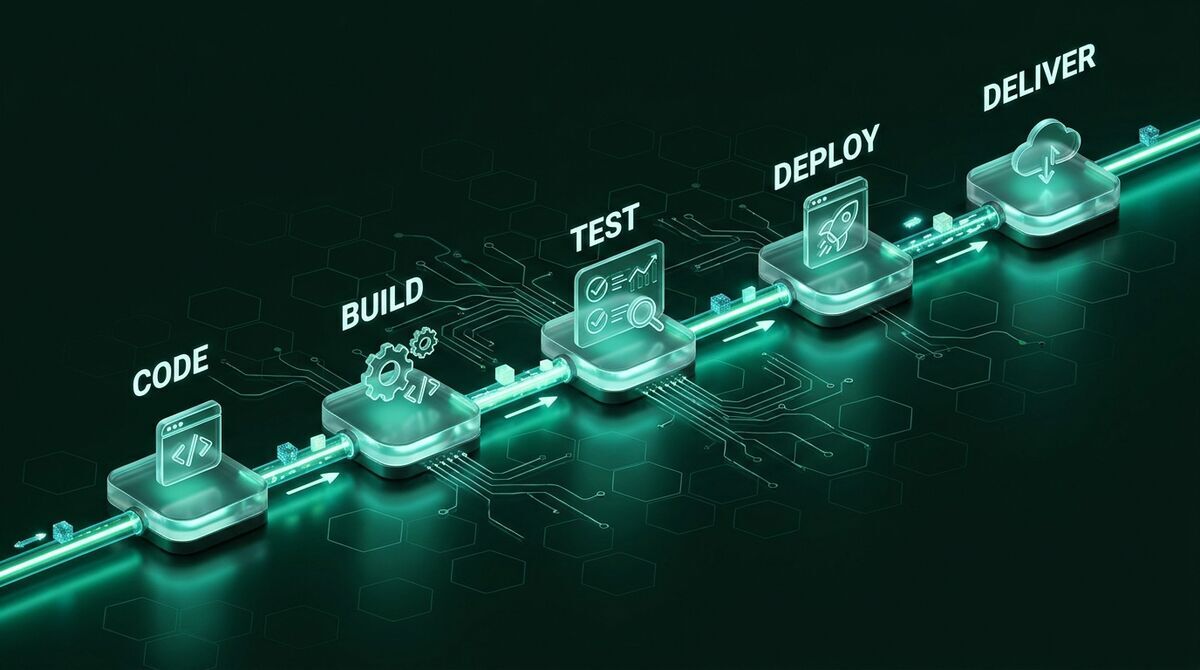
CI/CD Pipelines Explained: Enterprise Architecture, DevSecOps, and High-Performance GitOps
"A comprehensive engineering guide to modern CI/CD: Trunk-Based Development, DevSecOps (Gitleaks, Semgrep, Trivy, Cosign), BuildKit caching, GitOps with ArgoCD, progressive canary delivery, and DORA metrics."
Over the past decade, continuous integration and continuous delivery pipelines have evolved from fragile Bash scripts running on monolithic Jenkins servers into the circulatory system of modern engineering platforms. In organizations managing hundreds of microservices and dozens of daily deployments per engineer, an inefficient pipeline does not merely cause minor friction: it freezes business value delivery, degrades system reliability, and introduces critical attack vectors across the software supply chain.
As a Principal Platform Engineer who has led cloud-native migrations across large-scale financial and enterprise systems, I have observed that catastrophic production outages rarely stem from isolated bugs in business logic. Almost invariably, they are the direct byproduct of delayed integration cycles, exposed cluster credentials in CI agents, absent cryptographic supply chain controls, and all-or-nothing deployments without automated rollback capabilities.
In this deep-dive technical guide, we will deconstruct the complete architecture of an enterprise-grade CI/CD pipeline—from Trunk-Based Development to declarative GitOps reconciliation, cryptographic supply chain hardening with DevSecOps, and extreme cache optimization designed to achieve sub-5-minute feedback loops.
1. Fundamentals and Architecture: Deconstructing the Acronym (CI vs CD vs CD)
One of the most widespread industry misconceptions is using “CI/CD” as a single, interchangeable buzzword. Understanding the operational boundaries, contracts, and responsibilities of each phase is essential for designing high-velocity delivery platforms.
+---------------------------------------------------------------------------------------+
|                                  THE CI/CD LIFECYCLE                                  |
+---------------------------------------------------------------------------------------+
|  [ Commit ] ---> [ Continuous Integration (CI) ]                                      |
|                       |-> Lint, Compile, Matrix Unit Tests, SAST, SCA                 |
|                       \-> Build Artifact & Cryptographic Signing                      |
|                                     |                                                 |
|                                     v                                                 |
|                   [ Continuous Delivery (CD) ]                                        |
|                       |-> Deploy to Staging / Pre-Production                          |
|                       |-> Automated Smoke & Integration Tests                         |
|                       \-> Artifact Always Releasable (Manual Gate to Prod)            |
|                                     |                                                 |
|                                     v                                                 |
|                   [ Continuous Deployment (CD) ]                                      |
|                       |-> Automated GitOps Sync to Production                         |
|                       \-> Canary / Blue-Green with Automated Metric Rollback          |
+---------------------------------------------------------------------------------------+
Continuous Integration (CI): The True Definition
Continuous Integration is not merely maintaining a YAML workflow in GitHub Actions or GitLab CI that runs tests when a Pull Request is opened.
As originally codified by Martin Fowler, Continuous Integration is an engineering discipline in which all team members integrate their work into the mainline trunk (or main) at least once a day. Every integration is verified by an automated build and test execution to detect integration defects as early as possible.
If your engineering team maintains feature branches open for two weeks and only triggers the pipeline at the very end, you are not practicing Continuous Integration; you are performing delayed Batch Integration with test automation.
Continuous Delivery vs. Continuous Deployment
- Continuous Delivery (CD): Ensures that every approved change that clears the CI pipeline produces a validated artifact (container image, binary package, Helm chart) that is technically in a releasable state for production at any arbitrary moment. The actual deployment to production requires a business decision or manual trigger (e.g., clicking an approval gate in a platform portal or promoting an image tag in a GitOps repository).
- Continuous Deployment (CD): Eliminates human gates entirely along the path to production. Any commit that passes automated testing, compliance scans, and security checks on the trunk branch is deployed straight to production, typically safeguarded by progressive delivery mechanisms (canary deployments) and synthetic monitoring.
Trunk-Based Development vs. GitFlow: Why Long-Lived Branches Kill Velocity
Your branching model directly dictates your pipeline velocity and organizational agility. In the early 2010s, GitFlow gained widespread adoption with its dedicated branches (develop, release/*, feature/*, hotfix/*, main). However, in modern cloud-native engineering, GitFlow represents a severe bottleneck.
The Anatomy of “Merge Hell” in GitFlow
- Multiple engineers work on isolated feature branches diverging from
developfor weeks. - Meanwhile,
developabsorbs dozens of commits from adjacent teams. - When the time comes to merge, silent semantic collisions emerge: the code compiles cleanly and local tests pass, but runtime behavior fails when interacting with upstream changes.
- Organizations resort to dreaded “code freezes” and release branches requiring days of manual stabilization and manual regression passes.
The Trunk-Based Development Paradigm
In Trunk-Based Development (TBD), all engineers push small, frequent changes directly to main (or via short-lived ephemeral branches merged within 24 hours following concise peer review).
| Metric / Dimension | GitFlow | Trunk-Based Development |
|---|---|---|
| Branch Lifespan | Days to weeks (feature/*, release/*) |
Hours (maximum 1 day) |
| Integration Frequency | Infrequent (per major functional milestone) | Multiple times a day per engineer |
| Conflict Resolution | Painful, manual, high-anxiety (Merge Hell) | Trivial, continuous, and incremental |
| Incomplete Features | Isolated long-lived branches | Runtime Feature Flags (Toggles) |
| Deployment Frequency | Weekly, bi-weekly, or monthly batches | Multiple daily deployments to production |
| Lead Time for Changes | Days or weeks | Minutes to a few hours |
[!TIP] The Golden Rule: If a feature requires more than one day of engineering effort, do not let it linger on an isolated branch. Decompose the implementation into small incremental commits, guard the execution path with a Feature Flag toggled off in production, and integrate into
maincontinuously.
2. Shift-Left Strategy & DevSecOps: Cryptographic Supply Chain Security
Historically, software security was a late-stage gatekeeper audit conducted by an external security team immediately prior to a scheduled release. The Shift-Left paradigm moves security checks directly into the developer’s local environment and into the earliest stages of the CI pipeline.
Today, simply scanning code for vulnerabilities is insufficient; the software supply chain has become the primary adversary attack vector (dependency confusion, stolen CI runner tokens, tampered container base layers).
The 5 Critical Pillars of DevSecOps
- Secret Scanning: Preventing API credentials, cloud provider access tokens, and private TLS keys from polluting Git commit history. Tools such as Gitleaks must run both in local pre-commit hooks (
husky) and as the non-negotiable first step of the CI pipeline. - SAST (Static Application Security Testing): Analyzing source code abstract syntax trees (ASTs) to detect SQL injection, cross-site scripting (XSS), insecure deserialization, and cryptographic flaws. Modern engines like Semgrep evaluate declarative, lightweight rule definitions with sub-second execution speeds.
- SCA (Software Composition Analysis): Scanning application dependency trees (npm, pip, Go modules, Cargo) and base operating system packages. Trivy cross-references vulnerabilities (CVEs) against databases like NVD and GitHub Security Advisories.
- SBOM (Software Bill of Materials): Generating an authoritative, machine-readable inventory of all third-party components, packages, and licenses that comprise the final artifact using industry standards such as CycloneDX or SPDX via tools like Syft.
- Cryptographic Signing and Attestation (Cosign / Sigstore): Guaranteeing container immutability and provenance. Through keyless signing anchored in OpenID Connect (OIDC) identity tokens and the Rekor public transparency ledger, container images are signed during the build phase so that Kubernetes admission controllers accept only verified, authentic workloads.
Complete Enterprise DevSecOps Workflow in GitHub Actions
The following production-ready workflow establishes an end-to-end pipeline covering secret detection, AST-based SAST with SARIF upload to GitHub Security, container vulnerability scanning with Trivy, SBOM generation, and keyless container signing with Cosign:
# .github/workflows/ci-devsecops.yml
name: Enterprise CI & DevSecOps Pipeline

on:
  push:
    branches: [main]
  pull_request:
    branches: [main]

permissions:
  contents: read
  security-events: write
  id-token: write # Mandatory for keyless OIDC authentication with Cosign / Sigstore
  packages: write

env:
  REGISTRY: ghcr.io
  IMAGE_NAME: ${{ github.repository }}

jobs:
  # -----------------------------------------------------------
  # STAGE 1: Early Secret Detection
  # -----------------------------------------------------------
  secret-scan:
    name: Secret Scanning (Gitleaks)
    runs-on: ubuntu-latest
    steps:
      - name: Checkout Source Code
        uses: actions/checkout@v4
        with:
          fetch-depth: 0 # Full git history required to inspect all commits

      - name: Run Gitleaks
        uses: gitleaks/gitleaks-action@v2
        env:
          GITHUB_TOKEN: ${{ secrets.GITHUB_TOKEN }}
          GITLEAKS_LICENSE: ${{ secrets.GITLEAKS_LICENSE }} # Optional for OSS

  # -----------------------------------------------------------
  # STAGE 2: SAST (Static Application Security Testing)
  # -----------------------------------------------------------
  sast:
    name: SAST (Semgrep)
    needs: secret-scan
    runs-on: ubuntu-latest
    steps:
      - name: Checkout Source Code
        uses: actions/checkout@v4

      - name: Run Semgrep OSS Rules
        run: |
          docker run --rm -v "${{ github.workspace }}:/src" \
            returntocorp/semgrep semgrep \
            --config=auto \
            --sarif --output=/src/semgrep.sarif

      - name: Upload SAST SARIF to GitHub Security Tab
        uses: github/codeql-action/upload-sarif@v3
        if: always()
        with:
          sarif_file: semgrep.sarif

  # -----------------------------------------------------------
  # STAGE 3: Build, Testing, and Matrix Execution
  # -----------------------------------------------------------
  test:
    name: Unit & Integration Tests
    needs: secret-scan
    runs-on: ubuntu-latest
    strategy:
      matrix:
        node-version: [20.x, 22.x]
    steps:
      - name: Checkout Source Code
        uses: actions/checkout@v4

      - name: Setup Node.js ${{ matrix.node-version }}
        uses: actions/setup-node@v4
        with:
          node-version: ${{ matrix.node-version }}
          cache: 'pnpm'

      - name: Install Dependencies
        run: pnpm install --frozen-lockfile

      - name: Run Linter & Unit Tests
        run: |
          pnpm run lint
          pnpm run test:unit -- --coverage

  # -----------------------------------------------------------
  # STAGE 4: Container Build, SBOM, SCA, and Cosign Signing
  # -----------------------------------------------------------
  build-and-sign:
    name: Build, Scan & Sign Container Image
    needs: [sast, test]
    runs-on: ubuntu-latest
    if: github.event_name == 'push' && github.ref == 'refs/heads/main'
    outputs:
      image-digest: ${{ steps.build.outputs.digest }}
    steps:
      - name: Checkout Source Code
        uses: actions/checkout@v4

      - name: Set up Docker Buildx
        uses: docker/setup-buildx-action@v3

      - name: Log in to GitHub Container Registry
        uses: docker/login-action@v3
        with:
          registry: ${{ env.REGISTRY }}
          username: ${{ github.actor }}
          password: ${{ secrets.GITHUB_TOKEN }}

      - name: Extract Metadata & Tags
        id: meta
        uses: docker/metadata-action@v5
        with:
          images: ${{ env.REGISTRY }}/${{ env.IMAGE_NAME }}
          tags: |
            type=sha,prefix=sha-,format=short
            type=raw,value=latest

      - name: Build and Push Docker Image (with BuildKit Cache)
        id: build
        uses: docker/build-push-action@v6
        with:
          context: .
          push: true
          tags: ${{ steps.meta.outputs.tags }}
          labels: ${{ steps.meta.outputs.labels }}
          cache-from: type=gha
          cache-to: type=gha,mode=max

      # SBOM Generation with Syft in CycloneDX Standard
      - name: Generate SBOM (CycloneDX)
        uses: anchore/sbom-action@v0
        with:
          image: ${{ env.REGISTRY }}/${{ env.IMAGE_NAME }}:sha-${{ steps.meta.outputs.version }}
          format: cyclonedx-json
          output-file: sbom.cyclonedx.json

      # Container Vulnerability Scan with Trivy
      - name: Run Trivy Vulnerability Scanner
        uses: aquasecurity/trivy-action@0.29.0
        with:
          image-ref: ${{ env.REGISTRY }}/${{ env.IMAGE_NAME }}:sha-${{ steps.meta.outputs.version }}
          format: 'sarif'
          output: 'trivy-results.sarif'
          severity: 'CRITICAL,HIGH'
          exit-code: '1' # Fails build if unmitigated high/critical CVEs exist
          ignore-unfixed: true

      - name: Upload Container Scan SARIF to GitHub
        uses: github/codeql-action/upload-sarif@v3
        if: always()
        with:
          sarif_file: 'trivy-results.sarif'

      # Cryptographic Container Signing with Cosign (Keyless Sigstore)
      - name: Install Cosign
        uses: sigstore/cosign-installer@v3

      - name: Sign Container Image (Keyless OIDC)
        run: |
          cosign sign --yes \
            ${{ env.REGISTRY }}/${{ env.IMAGE_NAME }}@${{ steps.build.outputs.digest }}
[!IMPORTANT] SLSA Level 3 & Compliance: Keyless signing with Cosign using GitHub OIDC identity tokens (
id-token: write) binds the built container image to the exact Git commit SHA and the originating workflow file on the immutable Rekor public transparency log. Any attempt to inject an unauthorized image directly into the registry will be immediately blocked by Kubernetes admission webhooks.
3. Performance Optimization & Caching: Slashing Builds from 30 Minutes to 3 Minutes
In many enterprises, CI pipelines take between 20 and 45 minutes to execute. This latency cripples engineering productivity:
- It destroys developer flow state, forcing engineers to switch contexts while waiting.
- It discourages small, frequent commits: developers bundle massive batches of code to avoid waiting in the CI queue.
- It inflates cloud compute spending and causes runner queue starvation during peak hours.
A world-class microservice CI pipeline should finish in under 5 minutes (with a target of 2 to 3 minutes). Below are the battle-tested engineering techniques to achieve this.
1. Docker BuildKit and Cache Mounts
The most frequent culprit in slow container builds is re-downloading entire package dependency trees on every single CI invocation. Using Docker BuildKit cache mounts (--mount=type=cache), package manager storage directories persist across builds without inflating intermediate image layers.
Below is an enterprise-grade, multi-stage Dockerfile pairing BuildKit cache mounts with a minimal, secure Google Distroless runtime image:
# syntax=docker/dockerfile:1.7
# Production-optimized Dockerfile leveraging BuildKit Cache Mounts

# =============================================================
# STAGE 1: Build & Compilation
# =============================================================
FROM node:22-bookworm-slim AS builder

WORKDIR /app

# Enable pnpm deterministically via corepack
ENV PNPM_HOME="/pnpm"
ENV PATH="$PNPM_HOME:$PATH"
RUN corepack enable

# Copy ONLY dependency manifests first
# This preserves Docker layer cache when application source code changes
COPY package.json pnpm-lock.yaml ./

# Mount pnpm package cache directly from the BuildKit host
# Bypasses re-downloading identical packages, slashing install time from 90s to 4s
RUN --mount=type=cache,id=pnpm,target=/pnpm/store \
    pnpm install --frozen-lockfile

# Copy application source files
COPY . .

# Build the production bundle
RUN pnpm run build

# Prune development dependencies to minimize disk footprint
RUN --mount=type=cache,id=pnpm,target=/pnpm/store \
    pnpm prune --prod

# =============================================================
# STAGE 2: Minimal & Hardened Runtime (Google Distroless)
# =============================================================
# Drops shells, package managers, and standard GNU utilities
FROM gcr.io/distroless/nodejs22-debian12:nonroot AS runner

WORKDIR /app

# Execute as unprivileged non-root user (UID 65532 in distroless)
USER nonroot:nonroot

# Copy exclusively production dependencies and compiled build outputs
COPY --from=builder --chown=nonroot:nonroot /app/node_modules ./node_modules
COPY --from=builder --chown=nonroot:nonroot /app/dist ./dist
COPY --from=builder --chown=nonroot:nonroot /app/package.json ./package.json

ENV NODE_ENV=production
ENV PORT=8080
EXPOSE 8080

ENTRYPOINT ["/nodejs/bin/node", "dist/server/entry.mjs"]
2. Efficient Docker Layering and Invalidation Order
Docker evaluates layer caches sequentially from top to bottom. As soon as an instruction alters the build context, all subsequent layers forfeit their cached state:
- Common Anti-Pattern:
COPY . . RUN npm install # Breaks cache on EVERY commit, re-downloading all dependencies - Optimal Pattern:
COPY package.json pnpm-lock.yaml ./
RUN pnpm install --frozen-lockfile # Re-runs ONLY when lockfiles change
COPY . .
3. Test Parallelization and Matrix Splitting
Splitting a 15-minute monolithic test run into parallel slices drastically reduces wall-clock time:
- Concurrent jobs: Run Linter, Unit Tests, Integration Tests, and SAST scans simultaneously rather than sequentially.
- Test sharding: Leverage native runner sharding (e.g.,
jest --shard=1/4, Vitest shards, or Playwright sharding) to partition test execution across multiple ephemeral runner nodes.
4. Dynamic Ephemeral Runners with Actions Runner Controller (ARC)
Running CI workloads on shared, persistent virtual machines introduces two fundamental issues:
- State contamination: Stale files from prior jobs, locked networking ports, and leaked credentials.
- Peak-hour queuing bottlenecks: When 50 engineers open Pull Requests at 11:00 AM, static runner pools saturate, leaving builds waiting 20 minutes before execution begins.
The Enterprise Platform Solution: Deploy Actions Runner Controller (ARC) inside a dedicated Kubernetes cluster.
- ARC subscribes to GitHub webhook events and provisions ephemeral runner pods on demand using KEDA or the native ARC autoscaling listener.
- Each pipeline job executes inside a sterile, single-use pod that is destroyed immediately upon completion.
- If 100 jobs hit the queue concurrently, Kubernetes scales out 100 pods in seconds, leveraging cost-effective SPOT/preemptible instances via Karpenter on AWS EKS or GCP GKE.
4. The Paradigm Shift: From CI Push to GitOps Pull
For years, the standard deployment pattern involved provisioning cluster-admin credentials (KUBECONFIG) inside CI servers to execute imperative commands such as kubectl apply -f manifest.yaml or helm upgrade --install.
This model is known as CI Push, and in modern enterprise architectures, it represents a critical security and operational anti-pattern.
+---------------------------------------------------------------------------------------+
|                              CI PUSH (CRITICAL ANTI-PATTERN)                          |
+---------------------------------------------------------------------------------------+
|  [ CI Runner ] ======( Admin Credentials / KUBECONFIG )======> [ Kubernetes Cluster ] |
|  * Massive supply chain attack surface in CI                                          |
|  * Completely blind to Configuration Drift (manual cluster edits break state)         |
|  * Exposes Kubernetes API server to public internet ingress                           |
+---------------------------------------------------------------------------------------+

+---------------------------------------------------------------------------------------+
|                              GITOPS PULL (MODERN STANDARD)                            |
+---------------------------------------------------------------------------------------+
|  [ CI Pipeline ] ---> Updates image tag in [ Git Config Repo ]                        |
|                                                     ^                                 |
|                                                     | (Secure Pull / Polling)         |
|                                          [ ArgoCD / Flux Operator ]                   |
|                                          (Running INSIDE the cluster)                 |
|                                                     |                                 |
|                                                     v                                 |
|                                          [ Automated Reconciliation ]                 |
|                                          * Zero inbound ports exposed                 |
|                                          * Drift detection and self-healing in seconds|
+---------------------------------------------------------------------------------------+
Why the CI Push Model is Dangerous
- Broad Attack Surface and Credential Theft: A high-privilege
KUBECONFIGstored in GitHub Actions secrets can be compromised if an attacker exploits a malicious third-party build dependency or executes arbitrary code via an unreviewed Pull Request. - Blindness to Configuration Drift: If an on-call engineer runs
kubectl edit deployment api-serviceduring a late-night incident to bump memory limits, Git has no visibility into this change. When the next CI pipeline executeskubectl apply, it will silently overwrite the emergency fix or trigger erratic behavior. - Loss of Single Source of Truth: Under the Push model, the actual runtime state of the cluster rarely matches what is declared in source control.
The GitOps Pull Model with ArgoCD
In GitOps (pioneered by Weaveworks and standardized by OpenGitOps), Git is the sole source of truth.
- An operator agent (such as ArgoCD or Flux) runs inside the target Kubernetes cluster.
- No inbound firewall ports or public Kubernetes API endpoints need to be opened to the CI infrastructure.
- The operator continuously observes the Git configuration repository, comparing the declared desired state against the cluster’s live state.
- If any divergence (drift) occurs, ArgoCD flags it immediately and, under
selfHeal: true, automatically restores the exact configuration defined in Git.
Two-Repository Architecture (Separation of Concerns)
In production, never store application code and deployment infrastructure manifests within the same Git repository:
- Application Repository (
app-service):- Contains business logic, unit tests, and the
Dockerfile. - The CI pipeline compiles code, runs DevSecOps scans, pushes container images to the registry (e.g.
ghcr.io/org/api:sha-a1b2c3d), and concludes by submitting an automated commit that updates the image tag in the GitOps configuration repo.
- Contains business logic, unit tests, and the
- GitOps Configuration Repository (
k8s-fleet-infra):- Houses declarative Kustomize overlays or Helm charts for each environment (
staging,production). - ArgoCD monitors this repository and reconciles changes into the target clusters.
- Houses declarative Kustomize overlays or Helm charts for each environment (
Production Manifest: ArgoCD Application
Below is a declarative ArgoCD Application resource configured with automated sync, orphaned resource pruning, and automatic drift remediation:
# argocd-application-prod.yaml
apiVersion: argoproj.io/v1alpha1
kind: Application
metadata:
  name: payment-service-production
  namespace: argocd
  finalizers:
    - resources-finalizer.argocd.argoproj.io # Cascading deletion guard
spec:
  project: production-workloads
  source:
    repoURL: 'https://github.com/my-enterprise/k8s-gitops-manifests.git'
    targetRevision: main
    path: environments/production/services/payment-service
  destination:
    server: 'https://kubernetes.default.svc'
    namespace: payments
  syncPolicy:
    automated:
      prune: true      # Removes resources from K8s if deleted from Git
      selfHeal: true   # Reverts unauthorized manual changes (kubectl edit) back to Git
    syncOptions:
      - CreateNamespace=true
      - PruneLast=true
      - ApplyOutOfSyncOnly=true
    retry:
      limit: 5
      backoff:
        duration: 5s
        factor: 2
        maxDuration: 3m
5. Progressive Delivery and Resilience in Production
Standard Kubernetes RollingUpdate deployments are inadequate for mission-critical services. In a RollingUpdate:
- New pods spin up and progressively replace old pods solely based on their startup and readiness probes (
readinessProbe). - If a new version harbors an application bug that throws HTTP 500 errors only under production traffic, or suffers from a slow memory leak, Kubernetes will continue swapping out healthy pods until 100% of your users are impacted.
- Recovery necessitates manual intervention or rolling forward with a new hotfix commit.
To mitigate this operational risk, platform engineering teams implement Progressive Delivery utilizing Argo Rollouts or Flagger.
Canary Deployments with Automated Metric Analysis
In a Canary deployment, the updated release initially receives a minuscule portion of live production traffic (e.g., 5%). A dedicated controller queries real-time telemetry from Prometheus (error rates, P99 latency, HTTP status codes). If the metrics stay within acceptable thresholds, traffic increases in defined stages (20%, 50%, 100%). If error rates spike, the controller automatically aborts the rollout and redirects 100% of traffic back to the stable release within seconds, requiring zero human interaction.
# canary-rollout-prometheus.yaml
apiVersion: argoproj.io/v1alpha1
kind: Rollout
metadata:
  name: order-api
  namespace: production
spec:
  replicas: 10
  strategy:
    canary:
      # Incremental traffic weighting steps
      steps:
        - setWeight: 5
        - pause: { duration: 5m } # Collect Prometheus metrics for 5m at 5% traffic
        - setWeight: 20
        - pause: { duration: 10m }
        - setWeight: 50
        - pause: { duration: 10m }
      # Link to automated Prometheus analysis template
      analysis:
        templates:
          - templateName: http-success-rate
        args:
          - name: service-name
            value: order-api
---
apiVersion: argoproj.io/v1alpha1
kind: AnalysisTemplate
metadata:
  name: http-success-rate
  namespace: production
spec:
  metrics:
    - name: success-rate
      interval: 1m
      successCondition: result[0] >= 0.995 # Requires >= 99.5% HTTP success rate
      failureLimit: 2 # Maximum 2 failed evaluations before triggering auto-abort
      provider:
        prometheus:
          address: http://prometheus-k8s.monitoring.svc:9090
          query: |
            sum(rate(http_requests_total{service="order-api",status!~"5.*"}[2m]))
            /
            sum(rate(http_requests_total{service="order-api"}[2m]))
Blue/Green vs. Canary: Strategic Comparison
| Evaluation Dimension | Blue/Green Deployment | Canary Deployment |
|---|---|---|
| Routing Mechanism | Provisions an entirely separate Green fleet; shifts 100% of ingress router traffic instantly. | Gradually routes traffic (5% -> 20% -> 100%) to canary pods alongside stable pods. |
| Blast Radius | If the Green deployment has a latent bug, 100% of users experience failure immediately. | Faults impact only the small canary allocation (5%), safeguarding the remaining 95%. |
| Infrastructure Overhead | High: Requires doubling cluster pod capacity (+100% compute overhead during cutover). | Low: Gradually replaces existing replicas in proportion to the assigned canary weight. |
| Pre-Traffic Validation | Enables comprehensive smoke and integration testing against Green before routing live users. | Validates behavior against live production workloads and genuine user behavior. |
| Rollback Velocity | Instantaneous (single router pointer switch). | Fast (instantaneous weight reassignment back to 0% canary). |
Decoupling Deployment from Release with Feature Flags
[!IMPORTANT] Core Platform Principle: Deploying code is fundamentally distinct from Releasing code.
- Deployment: The technical mechanism of placing binary containers into production infrastructure and ensuring operational health.
- Release: The business decision to expose a capability to end users.
By decoupling the two through Feature Flagging systems (such as LaunchDarkly, Unleash, or the CNCF standard OpenFeature):
- Features are deployed to production days or weeks before public launch in a dormant (“dark”) state.
- High-stress midnight or weekend deployment windows are permanently eliminated.
- Teams gain an instantaneous runtime kill-switch: if a newly enabled capability creates downstream database lockups, the flag is flipped off in milliseconds without triggering a redeployment or pipeline cycle.
6. DORA Metrics: The High-Performance Engineering Compass
In 2018, the DevOps Research and Assessment (DORA) research team—spearheaded by Dr. Nicole Forsgren, Gene Kim, and Jez Humble—empirically proved the correlation between four primary software delivery metrics and high-performing organizations.
A modern CI/CD pipeline should be instrumented to continuously track and optimize these four core indicators:
| DORA Metric | Technical Definition | Low Performer | Elite Performer |
|---|---|---|---|
| Deployment Frequency (DF) | How often an organization successfully pushes releases to production. | Between once per month and once every six months. | Multiple times per day on demand. |
| Lead Time for Changes (LTFC) | The clock time elapsed from initial code commit to running in production. | Between one month and six months. | Less than one hour. |
| Change Failure Rate (CFR) | The percentage of production deployments requiring emergency rollbacks or hotfixes. | 46% - 60% of all releases. | 0% - 15% (typically < 5%). |
| Mean Time to Recovery (MTTR) | The duration required to restore full service following a production incident. | Between one week and one month. | Less than one hour. |
Concrete Engineering Levers to Optimize Each Metric
+---------------------------------------------------------------------------------------+
|                         ENGINEERING LEVERS FOR DORA METRICS                           |
+---------------------------------------------------------------------------------------+
|  [ Deployment Frequency ]   <===  Trunk-Based Development + Small Batch Sizes         |
|  [ Lead Time for Changes ]  <===  Sub-5-Min CI Pipelines + Zero Manual CAB Approvals  |
|  [ Change Failure Rate ]    <===  DevSecOps Shift-Left + Automated Canary Analysis    |
|  [ Time to Restore (MTTR) ] <===  GitOps Self-Healing + Automated Metric Rollbacks    |
+---------------------------------------------------------------------------------------+- Driving Deployment Frequency (DF):
- Eliminate manual Change Advisory Boards (CAB). Verification must be fully automated via regression suites and compliance policies within the CI pipeline.
- Enforce small Pull Requests: PRs smaller than 200 lines of code are reviewed in minutes and deployed immediately.
- Compressing Lead Time for Changes (LTFC):
- Optimize CI duration using BuildKit cache mounts and matrix test sharding.
- Implement ephemeral preview environments spun up automatically for every Pull Request.
- Suppressing Change Failure Rate (CFR):
- Fortify integration boundaries with Consumer-Driven Contract testing (e.g., Pact).
- Enforce rigorous SAST, dependency vulnerability gates, and automated canary deployments in production.
- Minimizing Mean Time to Recovery (MTTR):
- Configure automated rollbacks via Argo Rollouts and Prometheus metrics upon detecting HTTP error spikes.
- Utilize Feature Flags as instantaneous operational kill-switches without requiring code redeployments.
7. CI/CD Pipeline Maturity Matrix
Use this technical evaluation matrix to assess the current maturity of your organization’s delivery pipelines and map a strategic pathway toward the Elite tier:
| Engineering Dimension | Level 1: Basic | Level 2: Intermediate | Level 3: Advanced | Level 4: Elite |
|---|---|---|---|---|
| Version Control | Traditional GitFlow with long-lived branches (> 1 week). Frequent merge hell. | Feature branches lasting 2–3 days with massive, manual Pull Request reviews. | Trunk-Based Development with branches living less than 24 hours. | Pure Trunk-Based Development supported by runtime Feature Flags in production. |
| Continuous Integration | Local developer build scripts run on shared servers. Manual testing. | Centralized CI executing unit tests. Pipeline runtime > 25 minutes. | Parallelized CI with dependency caching. Runtime < 8 minutes. Test sharding. | Hermetic builds with BuildKit and ephemeral K8s runners. Runtime < 3 minutes. |
| DevSecOps | Quarterly manual security audits conducted prior to compliance deadlines. | Basic dependency scans (npm audit) in CI without blocking policies. |
Gitleaks, Semgrep SAST, and Trivy blocking high/critical vulnerabilities on PRs. | Cosign keyless signing, automated CycloneDX SBOM generation, and SLSA admission control. |
| Delivery Strategy | Imperative deployments using manual kubectl apply or SSH scripts. |
CI Push pipeline storing cluster administrative credentials in CI secrets. | Declarative GitOps with ArgoCD utilizing manual or semi-automated sync. | GitOps Pull with continuous reconciliation, drift remediation, and automated Canary Rollouts. |
| Observability & DORA | No pipeline telemetry. Incidents detected via customer escalations. | Centralized logs and basic build duration timers in CI dashboard. | DORA metrics calculated manually. Infrastructure monitoring via Prometheus alerts. | Real-time DORA streaming dashboards. Automated rollback driven by SLO error budgets. |
Conclusion: Platform Engineering as a Force Multiplier
A world-class CI/CD pipeline is not an end in itself; it is the operational manifestation of an engineering culture grounded in confidence, determinism, and rapid feedback.
By eliminating long-lived branches, shifting security checks to the earliest commit, accelerating build cycles through aggressive caching, and decoupling infrastructure deployments from feature releases via GitOps and Feature Flags, engineering platforms eliminate the fear of production.
The outcome is predictable: engineers who deploy multiple times a day with mathematical certainty that their workloads will withstand traffic surges, preserve software supply chain integrity, and deliver continuous business value at modern enterprise velocity.